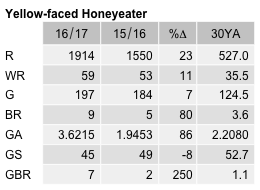
Yellow-faced Honeyeater
Caligavis chrysops
ABR description
The following is extracted from the Annual Bird Report for the twelve months to June 2017.
Very common, breeding resident/summer migrant
Migratory species with spectacular autumn departure in large flocks, some overwintering birds, but the majority returning in spring to breed, mainly in the mountains.
General: The reporting rate of 13.8% was slightly higher than last year (13.3%) although still well below the 30YA (19.3%). Increased observer effort this year has resulted in the number of records and the number of birds being higher than last year. The 2nd most commonly reported honeyeater, 46% of records in spring and 24% in autumn. Records of overwintering birds in the suburbs during July and August were common again this year (similar to last year) with the first large group of returning birds 90/10 Sep near Michelago GrL25 (LaS2). Autumn movement was first noted in late March 42/26 Mar along the Murrumbidgee north of ACT GrG09 (HeS1). Max during autumn migration 2000/19 Apr Gigerline GrK20 (BuM1), mean 11.6 median 2. 9 breeding records, 4 from Baroona Rd Michelago GrL25 (LaS2) where breeding has been recorded for the past 3 years. 2 broods recorded. Other records include the earliest record cf/18 Sep from Jerrabomberra Wetlands, Bibaringa GrH14, Kambah Pool and the latest record ny/26 Jan Namadgi NP Warks/Blundells Ck Rds (HoS1).
GBS: Recorded at 76% of sites (similar to last year) in all but 1 week. Abundance (A=2.7648) was significantly higher (42%) than last year, and 28 % higher than the 30YA. 6 overwintering records in July from only 2 sites, 12 in Aug from 7 sites. Spring return movement first noted in 1wk Sept with 30 in Weston GrJ15 (MaA2) and 25 in Duffy GrI15 (CaJ4), then small flocks of 8-40 in 2wk Sept from 9 sites. Autumn movement started strongly in 4wk Mar with flocks of 8-30 recorded from 8 sites. 9 Flocks of 100+ birds with largest flock 500 in 3wk and 4wk Apr from Pearce GrK15 (KrS1). 7 breeding records, 6 from the one site in Carwoola GrQ16, of 2 different breeding events. First nb/2wk Dec Carwoola (BuM1), last dy/5wk Jan Giralang GrK12 (McD4).
Abundance
Abundance is the average number of birds of that species per survey. Where the species was observed (presence recorded) but the number of birds seen was not recorded, this is treated as a count of zero.
Abundance by year
This chart shows the abundance of Yellow-faced Honeyeater between 1982 and 2017. 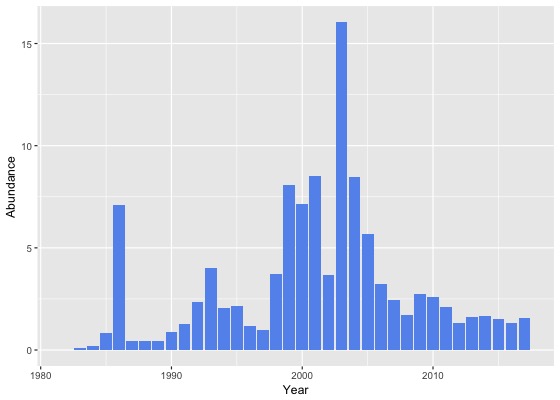
Abundance by month
This chart shows the monthly abundance of Yellow-faced Honeyeater. The blue lines show the abundance for the twelve months to June 2017 and the bars show the average abundance for the period 1982 to 2017. 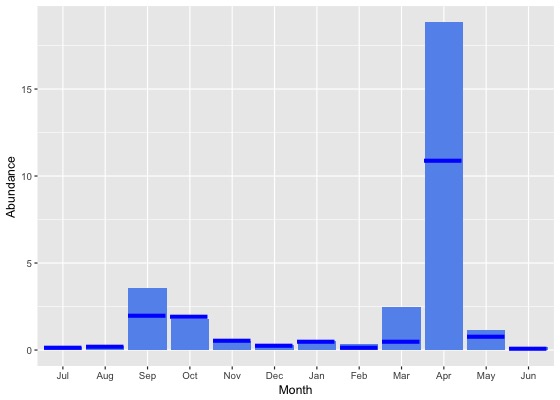
Abundance by season
This chart shows the seasonal abundance of Yellow-faced Honeyeater. The blue lines show the seasonal abundance for the twelve months to June 2017 and the bars show the average seasonal abundance for the period 1982 to 2017. 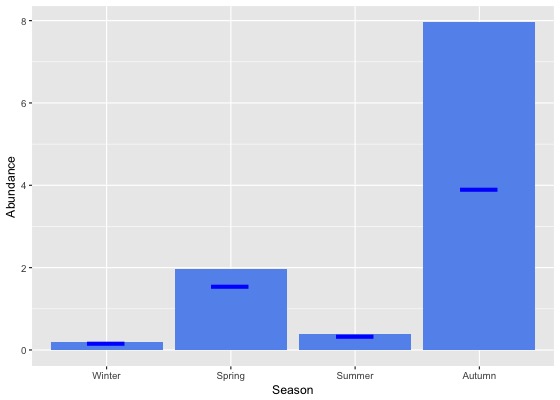
Abundance data
| Month | Season | ||||||||||||||||||
|---|---|---|---|---|---|---|---|---|---|---|---|---|---|---|---|---|---|---|---|
| Period | Jul | Aug | Sep | Oct | Nov | Dec | Jan | Feb | Mar | Apr | May | Jun | Winter | Spring | Summer | Autumn | All | ||
| All years | |||||||||||||||||||
| All | 0.2 | 0.2 | 3.6 | 1.8 | 0.5 | 0.3 | 0.5 | 0.4 | 2.4 | 18.8 | 1.2 | 0.2 | 0.2 | 2.0 | 0.4 | 8.0 | 2.7 | ||
| Previous years | |||||||||||||||||||
| All previous years | 0.2 | 0.3 | 3.8 | 1.7 | 0.5 | 0.3 | 0.5 | 0.4 | 2.8 | 20.1 | 1.2 | 0.2 | 0.2 | 2.0 | 0.4 | 8.7 | 2.9 | ||
| Previous 30 years | 0.2 | 0.3 | 3.8 | 1.7 | 0.5 | 0.3 | 0.5 | 0.4 | 2.8 | 20.1 | 1.2 | 0.2 | 0.2 | 2.0 | 0.4 | 8.7 | 2.9 | ||
| Previous 20 years | 0.2 | 0.3 | 4.4 | 1.9 | 0.5 | 0.3 | 0.4 | 0.4 | 3.2 | 22.6 | 1.4 | 0.2 | 0.2 | 2.3 | 0.4 | 9.8 | 3.3 | ||
| 10 year groups | |||||||||||||||||||
| [2007,2017) | 0.2 | 0.2 | 1.7 | 1.9 | 0.4 | 0.2 | 0.4 | 0.3 | 2.5 | 8.9 | 0.8 | 0.1 | 0.2 | 1.5 | 0.3 | 4.5 | 1.7 | ||
| [1997,2007) | 0.1 | 0.3 | 9.6 | 1.8 | 0.6 | 0.3 | 0.6 | 0.7 | 4.6 | 58.2 | 2.8 | 0.3 | 0.3 | 4.3 | 0.5 | 22.5 | 7.1 | ||
| [1987,1997) | 0.2 | 0.2 | 0.8 | 0.7 | 0.6 | 0.4 | 0.8 | 0.4 | 0.9 | 7.6 | 0.7 | 0.2 | 0.2 | 0.7 | 0.6 | 3.2 | 1.1 | ||
| 5 year groups | |||||||||||||||||||
| [2012,2017) | 0.2 | 0.3 | 1.1 | 1.8 | 0.3 | 0.2 | 0.4 | 0.3 | 2.6 | 7.3 | 1.0 | 0.2 | 0.2 | 1.2 | 0.3 | 3.9 | 1.5 | ||
| [2007,2012) | 0.2 | 0.2 | 3.1 | 2.0 | 0.6 | 0.2 | 0.5 | 0.5 | 2.2 | 12.7 | 0.3 | 0.1 | 0.1 | 2.1 | 0.4 | 6.1 | 2.3 | ||
| [2002,2007) | 0.1 | 0.3 | 13.6 | 2.1 | 0.6 | 0.2 | 0.5 | 0.5 | 4.1 | 58.9 | 1.9 | 0.1 | 0.2 | 5.8 | 0.4 | 21.9 | 7.3 | ||
| [1997,2002) | 0.1 | 0.4 | 4.9 | 1.5 | 0.6 | 0.3 | 0.7 | 0.9 | 5.3 | 57.4 | 3.9 | 0.6 | 0.4 | 2.5 | 0.6 | 23.3 | 6.8 | ||
| [1992,1997) | 0.0 | 0.2 | 1.4 | 0.9 | 0.6 | 0.4 | 1.4 | 0.3 | 1.5 | 17.1 | 1.3 | 0.1 | 0.1 | 0.9 | 0.8 | 6.9 | 2.2 | ||
| [1987,1992) | 0.2 | 0.2 | 0.6 | 0.6 | 0.6 | 0.5 | 0.5 | 0.4 | 0.5 | 2.2 | 0.4 | 0.2 | 0.2 | 0.6 | 0.5 | 1.1 | 0.6 | ||
| Year | |||||||||||||||||||
| 2017 | 0.2 | 0.2 | 2.0 | 1.9 | 0.6 | 0.3 | 0.5 | 0.2 | 0.5 | 10.9 | 0.8 | 0.1 | 0.2 | 1.5 | 0.3 | 3.9 | 1.6 | ||
| 2016 | 0.3 | 0.2 | 1.0 | 1.7 | 0.3 | 0.2 | 0.5 | 0.3 | 3.3 | 5.2 | 0.3 | 0.2 | 0.2 | 1.1 | 0.3 | 3.2 | 1.3 | ||
| 2015 | 0.2 | 0.3 | 1.3 | 1.9 | 0.4 | 0.3 | 0.3 | 0.3 | 1.7 | 9.2 | 1.0 | 0.1 | 0.2 | 1.3 | 0.3 | 4.2 | 1.5 | ||
| 2014 | 0.1 | 0.8 | 0.8 | 1.9 | 0.5 | 0.5 | 0.6 | 0.2 | 3.8 | 8.0 | 0.8 | 0.4 | 0.4 | 1.2 | 0.4 | 4.5 | 1.7 | ||
| 2013 | 0.0 | 0.0 | 2.0 | 1.7 | 0.2 | 0.1 | 0.2 | 0.1 | 1.8 | 10.8 | 0.2 | 0.0 | 0.0 | 1.4 | 0.2 | 4.8 | 1.6 | ||
| 2012 | 0.1 | 0.2 | 0.7 | 2.1 | 0.2 | 0.2 | 0.3 | 0.1 | 1.5 | 5.5 | 5.0 | 0.0 | 0.1 | 1.3 | 0.2 | 3.9 | 1.3 | ||
| 2011 | 0.1 | 0.1 | 2.9 | 1.5 | 1.0 | 0.1 | 0.2 | 0.1 | 0.7 | 15.0 | 0.1 | 0.2 | 0.1 | 1.8 | 0.2 | 5.5 | 2.1 | ||
| 2010 | 0.1 | 0.2 | 1.4 | 3.0 | 0.5 | 0.2 | 0.4 | 0.2 | 1.1 | 18.4 | 0.3 | 0.1 | 0.1 | 2.0 | 0.3 | 7.8 | 2.6 | ||
| 2009 | 0.2 | 0.4 | 2.2 | 2.0 | 0.5 | 0.3 | 0.8 | 0.7 | 2.8 | 17.5 | 0.2 | 0.0 | 0.1 | 1.7 | 0.6 | 8.3 | 2.8 | ||
| 2008 | 0.0 | 0.1 | 4.0 | 1.5 | 0.3 | 0.2 | 0.8 | 1.0 | 0.8 | 5.6 | 1.0 | 0.2 | 0.1 | 2.0 | 0.6 | 3.4 | 1.7 | ||
| 2007 | 0.7 | 0.4 | 5.3 | 2.4 | 0.7 | 0.4 | 0.6 | 0.8 | 5.9 | 8.7 | 0.3 | 0.0 | 0.2 | 2.9 | 0.5 | 5.8 | 2.4 | ||
| 2006 | 0.1 | 1.0 | 2.4 | 2.5 | 0.9 | 0.1 | 0.7 | 0.3 | 1.2 | 27.8 | 2.3 | 0.4 | 0.4 | 2.1 | 0.4 | 8.9 | 3.2 | ||
| 2005 | 0.2 | 0.5 | 3.5 | 1.0 | 0.3 | 0.3 | 0.9 | 0.8 | 7.3 | 49.6 | 0.9 | 0.1 | 0.2 | 2.0 | 0.5 | 17.8 | 5.7 | ||
| 2004 | 0.0 | 0.1 | 9.5 | 1.6 | 0.8 | 0.2 | 0.4 | 0.9 | 0.2 | 80.3 | 3.0 | 0.1 | 0.1 | 4.3 | 0.4 | 31.3 | 8.5 | ||
| 2003 | 0.2 | 0.1 | 47.1 | 2.1 | 0.3 | 0.2 | 0.3 | 0.4 | 11.1 | 94.7 | 1.5 | 0.0 | 0.1 | 17.9 | 0.3 | 40.8 | 16.0 | ||
| 2002 | 0.1 | 0.0 | 4.5 | 2.7 | 0.9 | 0.3 | 0.2 | 0.3 | 1.5 | 34.0 | 3.1 | 0.0 | 0.0 | 2.7 | 0.3 | 13.3 | 3.7 | ||
| 2001 | 0.2 | 0.5 | 11.6 | 1.9 | 0.9 | 0.6 | 0.7 | 1.4 | 2.9 | 82.0 | 1.5 | 0.0 | 0.2 | 6.0 | 0.9 | 25.4 | 8.5 | ||
| 2000 | 0.2 | 0.6 | 1.2 | 1.3 | 0.9 | 0.3 | 0.5 | 0.5 | 2.1 | 64.8 | 10.3 | 0.3 | 0.4 | 1.1 | 0.4 | 28.0 | 7.1 | ||
| 1999 | 0.0 | 0.2 | 1.9 | 1.3 | 0.7 | 0.4 | 1.0 | 1.1 | 2.5 | 63.5 | 3.5 | 1.7 | 1.1 | 1.3 | 0.8 | 24.1 | 8.1 | ||
| 1998 | 0.0 | 0.3 | 1.5 | 1.6 | 0.1 | 0.2 | 0.9 | 0.2 | 29.7 | 0.3 | 1.1 | 0.0 | 0.1 | 1.1 | 0.4 | 17.6 | 3.7 | ||
| 1997 | 0.0 | 0.0 | 0.8 | 0.8 | 0.2 | 0.1 | 0.7 | 0.4 | 1.0 | 5.5 | 0.8 | 0.0 | 0.0 | 0.6 | 0.3 | 3.5 | 1.0 | ||
| 1996 | 0.1 | 0.0 | 0.4 | 0.4 | 0.1 | 0.2 | 0.8 | 0.7 | 0.1 | 15.4 | 0.1 | 0.3 | 0.1 | 0.3 | 0.5 | 4.5 | 1.2 | ||
| 1995 | 0.0 | 0.0 | 1.3 | 0.2 | 0.4 | 0.6 | 1.5 | 0.0 | 1.4 | 16.9 | 0.4 | 0.1 | 0.0 | 0.6 | 0.9 | 7.6 | 2.2 | ||
| 1994 | 0.0 | 0.6 | 1.2 | 0.6 | 0.6 | 0.7 | 2.3 | 0.2 | 0.5 | 10.3 | 1.6 | 0.0 | 0.2 | 0.7 | 1.1 | 5.1 | 2.0 | ||
| 1993 | 0.0 | 0.3 | 4.0 | 1.7 | 0.9 | 0.6 | 1.9 | 0.2 | 1.5 | 37.7 | 0.3 | 0.0 | 0.1 | 2.1 | 1.0 | 11.0 | 4.0 | ||
| 1992 | 0.0 | 0.0 | 0.9 | 2.6 | 0.9 | 0.2 | 0.7 | 0.3 | 5.1 | 13.2 | 3.9 | 0.0 | 0.0 | 1.5 | 0.4 | 7.0 | 2.4 | ||
| 1991 | 0.6 | 0.1 | 0.8 | 1.2 | 1.5 | 0.2 | 0.7 | 1.1 | 0.4 | 9.8 | 0.4 | 0.0 | 0.3 | 1.2 | 0.6 | 3.4 | 1.3 | ||
| 1990 | 0.1 | 0.2 | 0.3 | 0.2 | 0.3 | 0.3 | 0.3 | 0.3 | 0.6 | 8.2 | 1.0 | 0.2 | 0.2 | 0.3 | 0.3 | 3.3 | 0.9 | ||
| 1989 | 0.1 | 0.2 | 0.7 | 0.7 | 0.4 | 0.5 | 0.6 | 0.4 | 0.4 | 0.7 | 0.4 | 0.2 | 0.2 | 0.6 | 0.5 | 0.5 | 0.5 | ||
| 1988 | 0.2 | 0.3 | 0.5 | 0.6 | 0.5 | 0.5 | 0.5 | 0.4 | 0.6 | 0.7 | 0.3 | 0.1 | 0.2 | 0.5 | 0.5 | 0.5 | 0.4 | ||
| 1987 | 0.2 | 0.1 | 0.5 | 0.6 | 0.5 | 0.4 | 0.4 | 0.3 | 0.4 | 0.6 | 0.4 | 0.3 | 0.3 | 0.5 | 0.4 | 0.5 | 0.4 | ||
| 1986 | 0.1 | 0.0 | 5.5 | 3.9 | 3.4 | 1.5 | 3.1 | 0.9 | 1.4 | 43.8 | 2.6 | 0.2 | 0.1 | 4.4 | 1.7 | 21.2 | 7.1 | ||
| 1985 | 0.3 | 0.2 | 1.0 | 2.2 | 0.7 | 0.3 | 0.1 | 0.2 | 0.9 | 0.1 | 0.0 | 0.2 | 0.2 | 1.4 | 0.3 | 0.3 | 0.8 | ||
| 1984 | 0.0 | 0.0 | 0.0 | 0.0 | 0.0 | 0.0 | 0.1 | 0.1 | 0.2 | 0.5 | 0.3 | 0.4 | 0.2 | 0.0 | 0.1 | 0.3 | 0.2 | ||
| 1983 | 0.0 | 0.0 | 0.0 | 0.2 | 0.4 | 0.2 | 0.0 | 0.0 | 0.0 | - | 0.0 | 0.0 | 0.0 | 0.2 | 0.1 | 0.0 | 0.1 | ||
| 1982 | - | 0.0 | - | 0.0 | 0.0 | 0.0 | - | 0.0 | - | 0.0 | - | 0.0 | 0.0 | 0.0 | 0.0 | 0.0 | 0.0 | ||
Reporting rates
Reporting rate is the proportion of all surveys in which the species was present.
Reporting rate by year
This chart shows the reporting rate of Yellow-faced Honeyeater each year between 1982 and 2017. 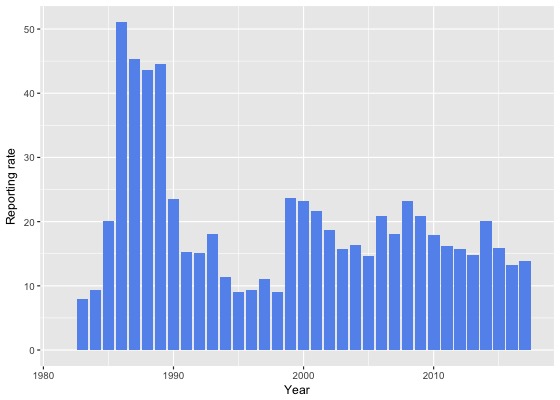
Reporting rate by month
This chart shows the reporting rate by month of Yellow-faced Honeyeater. The blue lines show the reporting rate for the twelve months to June 2017 and the bars show the average reporting rate for the period 1982 to 2017. 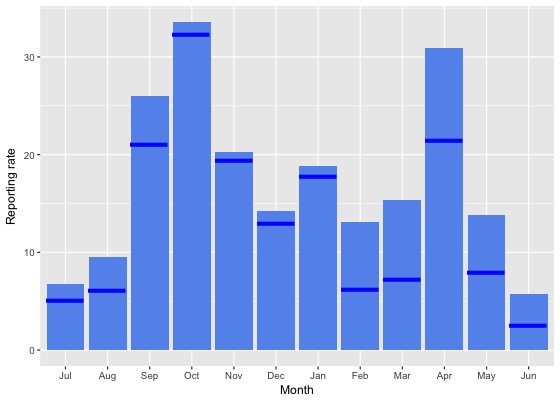
Reporting rate by season
This chart shows the seasonal reporting rate of Yellow-faced Honeyeater. The blue lines show the seasonal reporting rate for the twelve months to June 2017 and the bars show the average seasonal reporting rate for the period 1982 to 2017. 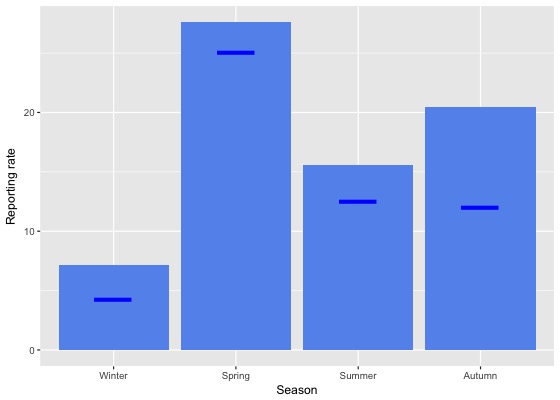
Reporting rate data
| Month | Season | ||||||||||||||||||
|---|---|---|---|---|---|---|---|---|---|---|---|---|---|---|---|---|---|---|---|
| Period | Jul | Aug | Sep | Oct | Nov | Dec | Jan | Feb | Mar | Apr | May | Jun | Winter | Spring | Summer | Autumn | All | ||
| All years | |||||||||||||||||||
| All | 6.8 | 9.5 | 26.0 | 33.5 | 20.2 | 14.2 | 18.9 | 13.1 | 15.3 | 30.9 | 13.8 | 5.8 | 7.2 | 27.6 | 15.6 | 20.5 | 18.6 | ||
| Previous years | |||||||||||||||||||
| All previous years | 7.0 | 10.2 | 26.7 | 33.7 | 20.4 | 14.4 | 19.1 | 14.6 | 16.7 | 32.4 | 15.2 | 6.4 | 7.7 | 27.9 | 16.2 | 22.1 | 19.5 | ||
| Previous 30 years | 7.0 | 10.3 | 26.6 | 33.7 | 19.9 | 14.2 | 19.0 | 14.6 | 16.7 | 32.3 | 14.9 | 6.3 | 7.7 | 27.8 | 16.0 | 21.9 | 19.3 | ||
| Previous 20 years | 5.8 | 8.6 | 24.1 | 32.6 | 15.8 | 10.8 | 16.0 | 12.0 | 14.2 | 29.4 | 12.0 | 5.0 | 6.3 | 25.7 | 13.0 | 19.3 | 17.1 | ||
| 10 year groups | |||||||||||||||||||
| [2007,2017) | 5.8 | 8.0 | 22.4 | 32.6 | 13.8 | 10.6 | 14.9 | 10.3 | 14.1 | 27.7 | 9.5 | 4.0 | 5.7 | 25.2 | 12.2 | 18.1 | 16.5 | ||
| [1997,2007) | 5.9 | 10.0 | 27.3 | 32.6 | 19.8 | 11.1 | 19.5 | 16.5 | 14.4 | 33.9 | 18.2 | 7.2 | 7.5 | 26.9 | 15.0 | 22.0 | 18.6 | ||
| [1987,1997) | 10.9 | 15.3 | 39.7 | 39.8 | 33.8 | 33.7 | 36.4 | 26.7 | 30.4 | 46.9 | 25.6 | 12.9 | 13.2 | 37.6 | 32.4 | 34.6 | 30.0 | ||
| 5 year groups | |||||||||||||||||||
| [2012,2017) | 5.8 | 8.1 | 21.1 | 30.5 | 12.7 | 11.2 | 14.1 | 9.2 | 14.0 | 26.6 | 9.3 | 4.1 | 5.9 | 23.1 | 11.8 | 17.4 | 15.4 | ||
| [2007,2012) | 5.9 | 7.5 | 25.3 | 36.2 | 16.8 | 9.3 | 17.8 | 14.7 | 14.5 | 30.3 | 9.8 | 3.8 | 5.1 | 29.5 | 13.4 | 19.9 | 19.1 | ||
| [2002,2007) | 4.1 | 6.5 | 27.6 | 35.2 | 19.6 | 10.3 | 17.0 | 15.5 | 13.7 | 31.5 | 13.9 | 4.6 | 4.9 | 28.1 | 13.5 | 19.7 | 17.4 | ||
| [1997,2002) | 8.8 | 14.2 | 27.0 | 28.8 | 20.1 | 12.1 | 22.3 | 17.6 | 15.3 | 36.9 | 23.5 | 10.7 | 11.2 | 25.4 | 16.8 | 24.9 | 20.1 | ||
| [1992,1997) | 2.2 | 5.3 | 16.5 | 15.4 | 12.6 | 11.4 | 16.6 | 8.2 | 13.0 | 22.6 | 10.6 | 4.8 | 4.2 | 14.7 | 12.6 | 15.7 | 12.0 | ||
| [1987,1992) | 14.8 | 20.8 | 50.7 | 53.2 | 44.0 | 43.4 | 47.3 | 33.7 | 40.7 | 60.8 | 33.4 | 17.4 | 17.8 | 49.1 | 41.4 | 45.3 | 39.1 | ||
| Year | |||||||||||||||||||
| 2017 | 5.0 | 6.1 | 21.1 | 32.3 | 19.4 | 13.0 | 17.8 | 6.2 | 7.3 | 21.5 | 8.0 | 2.5 | 4.3 | 25.1 | 12.6 | 12.0 | 13.8 | ||
| 2016 | 6.6 | 6.1 | 18.5 | 24.2 | 10.4 | 8.7 | 13.6 | 11.2 | 12.8 | 22.4 | 7.1 | 5.3 | 6.0 | 18.8 | 11.4 | 14.8 | 13.3 | ||
| 2015 | 7.5 | 11.9 | 24.0 | 31.4 | 13.9 | 13.2 | 11.5 | 9.1 | 14.2 | 30.4 | 9.9 | 3.1 | 6.7 | 24.3 | 11.3 | 18.8 | 15.9 | ||
| 2014 | 5.5 | 12.6 | 23.1 | 35.8 | 19.3 | 20.1 | 18.0 | 8.2 | 19.0 | 36.6 | 16.2 | 7.0 | 8.4 | 28.6 | 15.5 | 24.2 | 20.1 | ||
| 2013 | 0.5 | 3.2 | 23.3 | 34.4 | 12.3 | 8.1 | 13.9 | 6.5 | 9.3 | 28.1 | 8.4 | 1.8 | 1.8 | 25.2 | 9.8 | 16.0 | 14.8 | ||
| 2012 | 5.9 | 7.9 | 18.3 | 32.4 | 10.9 | 11.3 | 15.0 | 5.9 | 17.9 | 20.1 | 9.1 | 2.4 | 5.1 | 23.5 | 12.1 | 16.9 | 15.7 | ||
| 2011 | 5.7 | 4.0 | 22.1 | 34.5 | 20.6 | 8.0 | 14.2 | 10.0 | 10.9 | 32.0 | 6.9 | 3.8 | 4.2 | 28.5 | 10.9 | 17.1 | 16.3 | ||
| 2010 | 2.1 | 5.3 | 18.4 | 38.5 | 12.9 | 9.8 | 16.9 | 5.9 | 12.2 | 33.6 | 10.8 | 3.1 | 3.4 | 27.2 | 11.8 | 20.5 | 17.9 | ||
| 2009 | 12.2 | 14.6 | 30.1 | 38.7 | 15.6 | 8.5 | 23.3 | 15.8 | 18.1 | 21.3 | 9.9 | 0.5 | 7.0 | 31.5 | 15.3 | 17.6 | 20.9 | ||
| 2008 | 0.7 | 2.6 | 30.7 | 33.2 | 13.4 | 6.8 | 26.2 | 25.9 | 21.0 | 38.8 | 20.7 | 13.1 | 6.8 | 29.6 | 16.7 | 30.2 | 23.2 | ||
| 2007 | 8.8 | 13.0 | 25.3 | 36.7 | 23.0 | 12.8 | 15.7 | 18.3 | 13.2 | 22.2 | 5.7 | 0.3 | 4.5 | 30.9 | 14.8 | 15.2 | 18.1 | ||
| 2006 | 7.9 | 7.8 | 26.9 | 48.8 | 19.0 | 5.6 | 21.3 | 15.6 | 13.5 | 23.7 | 19.6 | 8.8 | 8.3 | 36.1 | 14.0 | 17.6 | 20.9 | ||
| 2005 | 8.8 | 9.3 | 22.3 | 16.6 | 15.9 | 9.6 | 25.5 | 22.8 | 13.0 | 23.5 | 11.9 | 3.8 | 6.3 | 19.0 | 16.7 | 15.8 | 14.7 | ||
| 2004 | 1.2 | 4.6 | 38.5 | 36.0 | 17.4 | 10.6 | 15.8 | 17.2 | 6.2 | 29.1 | 18.4 | 4.9 | 3.2 | 31.2 | 13.7 | 17.6 | 16.4 | ||
| 2003 | 0.9 | 6.5 | 26.3 | 19.7 | 14.7 | 8.9 | 10.4 | 11.0 | 19.7 | 41.5 | 6.2 | 3.1 | 3.6 | 20.4 | 9.9 | 25.0 | 15.7 | ||
| 2002 | 3.4 | 5.1 | 25.9 | 39.1 | 30.0 | 14.2 | 11.3 | 15.1 | 15.0 | 38.7 | 15.3 | 1.1 | 2.9 | 32.0 | 13.7 | 23.5 | 18.6 | ||
| 2001 | 8.9 | 15.1 | 29.7 | 44.1 | 27.3 | 19.2 | 25.0 | 20.1 | 14.5 | 35.1 | 12.7 | 4.9 | 9.3 | 33.7 | 21.2 | 20.0 | 21.7 | ||
| 2000 | 14.3 | 26.1 | 32.1 | 28.6 | 26.4 | 9.7 | 21.1 | 15.7 | 19.6 | 50.0 | 20.0 | 12.4 | 17.4 | 29.0 | 15.0 | 31.5 | 23.1 | ||
| 1999 | 5.9 | 3.1 | 29.3 | 22.0 | 16.2 | 14.4 | 25.5 | 23.6 | 16.2 | 40.7 | 42.0 | 20.1 | 13.9 | 22.8 | 20.8 | 33.0 | 23.7 | ||
| 1998 | 2.7 | 5.7 | 18.7 | 10.9 | 10.6 | 2.8 | 19.1 | 5.7 | 5.4 | 7.7 | 3.7 | 2.7 | 3.6 | 13.7 | 8.4 | 5.7 | 9.0 | ||
| 1997 | 4.6 | 6.9 | 14.5 | 17.1 | 12.0 | 5.8 | 13.7 | 12.3 | 15.0 | 16.5 | 13.3 | 2.8 | 4.6 | 14.2 | 9.4 | 15.5 | 11.1 | ||
| 1996 | 4.5 | 3.2 | 13.3 | 13.2 | 3.7 | 9.1 | 10.7 | 11.8 | 6.9 | 18.8 | 8.6 | 11.5 | 6.5 | 9.8 | 10.5 | 10.7 | 9.4 | ||
| 1995 | 0.0 | 2.3 | 6.8 | 8.5 | 15.5 | 8.0 | 15.9 | 3.2 | 9.2 | 19.4 | 10.4 | 5.3 | 2.5 | 10.1 | 10.3 | 13.7 | 9.1 | ||
| 1994 | 2.0 | 11.7 | 22.1 | 16.3 | 8.1 | 17.4 | 23.5 | 6.9 | 6.8 | 15.3 | 8.8 | 1.1 | 5.1 | 13.8 | 16.3 | 11.0 | 11.5 | ||
| 1993 | 4.1 | 9.0 | 27.4 | 22.7 | 21.2 | 26.1 | 22.4 | 6.2 | 25.9 | 33.3 | 11.7 | 4.3 | 6.1 | 23.6 | 19.7 | 22.9 | 18.1 | ||
| 1992 | 1.5 | 1.9 | 18.8 | 23.4 | 22.2 | 4.8 | 15.5 | 12.2 | 19.7 | 39.0 | 13.2 | 0.0 | 1.1 | 21.5 | 10.5 | 22.8 | 15.0 | ||
| 1991 | 7.9 | 5.3 | 15.1 | 19.4 | 21.6 | 6.8 | 21.4 | 14.0 | 12.7 | 49.2 | 14.8 | 2.0 | 5.9 | 18.9 | 13.3 | 25.1 | 15.2 | ||
| 1990 | 13.5 | 14.6 | 35.5 | 24.5 | 27.1 | 33.3 | 31.9 | 23.9 | 17.0 | 41.7 | 27.4 | 10.5 | 13.5 | 28.9 | 29.8 | 28.6 | 23.5 | ||
| 1989 | 8.7 | 20.7 | 65.5 | 65.4 | 41.9 | 52.2 | 61.7 | 42.3 | 42.8 | 63.6 | 41.4 | 18.5 | 16.1 | 58.7 | 52.0 | 50.1 | 44.6 | ||
| 1988 | 24.1 | 30.6 | 55.1 | 63.3 | 48.4 | 51.3 | 50.3 | 36.0 | 60.9 | 68.4 | 25.8 | 13.0 | 23.3 | 55.3 | 46.2 | 51.4 | 43.7 | ||
| 1987 | 27.3 | 20.0 | 51.8 | 55.5 | 53.1 | 42.7 | 43.6 | 32.1 | 37.8 | 62.1 | 41.5 | 27.5 | 27.0 | 53.5 | 39.0 | 47.7 | 45.4 | ||
| 1986 | 11.5 | 2.6 | 50.9 | 66.7 | 78.7 | 52.9 | 78.3 | 44.4 | 41.9 | 76.5 | 72.4 | 20.0 | 11.1 | 64.7 | 55.9 | 65.8 | 51.0 | ||
| 1985 | 13.3 | 13.3 | 19.2 | 30.2 | 22.8 | 20.0 | 12.5 | 5.9 | 27.3 | 21.1 | 0.0 | 14.3 | 13.6 | 25.1 | 16.5 | 17.5 | 20.1 | ||
| 1984 | 0.0 | 0.0 | 0.0 | 0.0 | 0.0 | 0.0 | 10.3 | 6.1 | 11.1 | 14.7 | 16.1 | 11.8 | 8.2 | 0.0 | 6.8 | 14.1 | 9.3 | ||
| 1983 | 0.0 | 0.0 | 0.0 | 15.4 | 44.4 | 15.4 | 0.0 | 0.0 | 0.0 | - | 0.0 | 0.0 | 0.0 | 22.2 | 6.7 | 0.0 | 8.0 | ||
| 1982 | - | 0.0 | - | 0.0 | 0.0 | 0.0 | - | 0.0 | - | 0.0 | - | 0.0 | 0.0 | 0.0 | 0.0 | 0.0 | 0.0 | ||
Breeding data
Breeding records by month
Number of breeding records by breeding code and month, 2017 and all years| Breeding code | Jul | Aug | Sep | Oct | Nov | Dec | Jan | Feb | Mar | Apr | May | Jun |
|---|---|---|---|---|---|---|---|---|---|---|---|---|
| 2017 | ||||||||||||
| Breeding (BLA code) | 0 | 0 | 0 | 0 | 0 | 0 | 0 | 0 | 0 | 0 | 0 | 0 |
| Carrying Food | 0 | 0 | 1 | 0 | 0 | 1 | 1 | 0 | 0 | 0 | 0 | 0 |
| Copulating | 0 | 0 | 0 | 0 | 0 | 0 | 0 | 0 | 0 | 0 | 0 | 0 |
| Display | 0 | 0 | 0 | 0 | 0 | 0 | 0 | 0 | 0 | 0 | 0 | 0 |
| Dependent young | 0 | 0 | 0 | 0 | 0 | 1 | 0 | 0 | 0 | 0 | 0 | 0 |
| Faecal sac | 0 | 0 | 0 | 0 | 0 | 0 | 0 | 0 | 0 | 0 | 0 | 0 |
| Inspecting hollow | 0 | 0 | 0 | 0 | 0 | 0 | 0 | 0 | 0 | 0 | 0 | 0 |
| Nest building | 0 | 0 | 0 | 1 | 0 | 0 | 0 | 0 | 0 | 0 | 0 | 0 |
| Nest with eggs | 0 | 0 | 0 | 0 | 0 | 0 | 0 | 0 | 0 | 0 | 0 | 0 |
| Nest with young | 0 | 0 | 0 | 0 | 1 | 0 | 1 | 0 | 0 | 0 | 0 | 0 |
| On/leaving nest | 0 | 0 | 0 | 0 | 1 | 1 | 0 | 0 | 0 | 0 | 0 | 0 |
| All years | ||||||||||||
| Breeding (BLA code) | 0 | 0 | 0 | 2 | 0 | 2 | 0 | 0 | 0 | 0 | 0 | 0 |
| Carrying Food | 0 | 0 | 1 | 1 | 2 | 4 | 6 | 2 | 0 | 0 | 0 | 0 |
| Copulating | 0 | 0 | 0 | 0 | 0 | 0 | 0 | 0 | 0 | 0 | 0 | 0 |
| Display | 0 | 0 | 0 | 0 | 0 | 0 | 0 | 0 | 0 | 0 | 0 | 0 |
| Dependent young | 0 | 0 | 0 | 4 | 1 | 3 | 21 | 18 | 2 | 1 | 0 | 0 |
| Faecal sac | 0 | 0 | 0 | 0 | 0 | 0 | 0 | 0 | 0 | 0 | 0 | 0 |
| Inspecting hollow | 0 | 0 | 0 | 0 | 0 | 0 | 0 | 0 | 0 | 0 | 0 | 0 |
| Nest building | 0 | 0 | 0 | 7 | 7 | 2 | 2 | 0 | 0 | 0 | 0 | 0 |
| Nest with eggs | 0 | 0 | 0 | 1 | 0 | 2 | 4 | 1 | 0 | 0 | 0 | 0 |
| Nest with young | 0 | 0 | 0 | 0 | 4 | 4 | 5 | 4 | 1 | 0 | 0 | 0 |
| On/leaving nest | 0 | 0 | 0 | 2 | 1 | 1 | 0 | 1 | 0 | 0 | 0 | 0 |
Breeding records by year
Average number of breeding records per period by breeding code| Period | Breeding (BLA code) | Carrying Food | Copulating | Display | Dependent young | Faecal sac | Inspecting hollow | Nest building | Nest with eggs | Nest with young | On/leaving nest |
|---|---|---|---|---|---|---|---|---|---|---|---|
| All years | |||||||||||
| All | 0.1 | 0.4 | 0.0 | 0.0 | 1.4 | 0.0 | 0.0 | 0.5 | 0.2 | 0.5 | 0.1 |
| Previous years | |||||||||||
| All previous years | 0.1 | 0.4 | 0.0 | 0.0 | 1.4 | 0.0 | 0.0 | 0.5 | 0.2 | 0.5 | 0.1 |
| Previous 30 years | 0.1 | 0.4 | 0.0 | 0.0 | 1.6 | 0.0 | 0.0 | 0.5 | 0.3 | 0.5 | 0.1 |
| Previous 20 years | 0.2 | 0.3 | 0.0 | 0.0 | 1.1 | 0.0 | 0.0 | 0.5 | 0.1 | 0.5 | 0.1 |
| 10 year groups | |||||||||||
| [2007,2017) | 0.4 | 0.3 | 0.0 | 0.0 | 1.6 | 0.0 | 0.0 | 0.8 | 0.2 | 0.8 | 0.3 |
| [1997,2007) | 0.0 | 0.3 | 0.0 | 0.0 | 0.6 | 0.0 | 0.0 | 0.1 | 0.0 | 0.2 | 0.0 |
| [1987,1997) | 0.0 | 0.7 | 0.0 | 0.0 | 2.5 | 0.0 | 0.0 | 0.7 | 0.6 | 0.6 | 0.0 |
| 5 year groups | |||||||||||
| [2012,2017) | 0.6 | 0.4 | 0.0 | 0.0 | 1.6 | 0.0 | 0.0 | 0.4 | 0.4 | 1.4 | 0.4 |
| [2007,2012) | 0.2 | 0.2 | 0.0 | 0.0 | 1.6 | 0.0 | 0.0 | 1.2 | 0.0 | 0.2 | 0.2 |
| [2002,2007) | 0.0 | 0.0 | 0.0 | 0.0 | 0.2 | 0.0 | 0.0 | 0.0 | 0.0 | 0.4 | 0.0 |
| [1997,2002) | 0.0 | 0.6 | 0.0 | 0.0 | 1.0 | 0.0 | 0.0 | 0.2 | 0.0 | 0.0 | 0.0 |
| [1992,1997) | 0.0 | 0.0 | 0.0 | 0.0 | 0.4 | 0.0 | 0.0 | 0.2 | 0.0 | 0.2 | 0.0 |
| [1987,1992) | 0.0 | 1.4 | 0.0 | 0.0 | 4.6 | 0.0 | 0.0 | 1.2 | 1.2 | 1.0 | 0.0 |
| Year | |||||||||||
| 2017 | 0.0 | 3.0 | 0.0 | 0.0 | 1.0 | 0.0 | 0.0 | 1.0 | 0.0 | 2.0 | 2.0 |
| 2016 | 0.0 | 0.0 | 0.0 | 0.0 | 1.0 | 0.0 | 0.0 | 0.0 | 1.0 | 3.0 | 0.0 |
| 2015 | 0.0 | 0.0 | 0.0 | 0.0 | 2.0 | 0.0 | 0.0 | 0.0 | 0.0 | 2.0 | 1.0 |
| 2014 | 1.0 | 0.0 | 0.0 | 0.0 | 3.0 | 0.0 | 0.0 | 1.0 | 0.0 | 0.0 | 1.0 |
| 2013 | 0.0 | 0.0 | 0.0 | 0.0 | 2.0 | 0.0 | 0.0 | 0.0 | 0.0 | 0.0 | 0.0 |
| 2012 | 2.0 | 2.0 | 0.0 | 0.0 | 0.0 | 0.0 | 0.0 | 1.0 | 1.0 | 2.0 | 0.0 |
| 2011 | 0.0 | 0.0 | 0.0 | 0.0 | 1.0 | 0.0 | 0.0 | 2.0 | 0.0 | 0.0 | 0.0 |
| 2010 | 0.0 | 1.0 | 0.0 | 0.0 | 0.0 | 0.0 | 0.0 | 3.0 | 0.0 | 1.0 | 0.0 |
| 2009 | 0.0 | 0.0 | 0.0 | 0.0 | 1.0 | 0.0 | 0.0 | 0.0 | 0.0 | 0.0 | 0.0 |
| 2008 | 0.0 | 0.0 | 0.0 | 0.0 | 5.0 | 0.0 | 0.0 | 0.0 | 0.0 | 0.0 | 0.0 |
| 2007 | 1.0 | 0.0 | 0.0 | 0.0 | 1.0 | 0.0 | 0.0 | 1.0 | 0.0 | 0.0 | 1.0 |
| 2006 | 0.0 | 0.0 | 0.0 | 0.0 | 0.0 | 0.0 | 0.0 | 0.0 | 0.0 | 0.0 | 0.0 |
| 2005 | 0.0 | 0.0 | 0.0 | 0.0 | 1.0 | 0.0 | 0.0 | 0.0 | 0.0 | 2.0 | 0.0 |
| 2004 | 0.0 | 0.0 | 0.0 | 0.0 | 0.0 | 0.0 | 0.0 | 0.0 | 0.0 | 0.0 | 0.0 |
| 2003 | 0.0 | 0.0 | 0.0 | 0.0 | 0.0 | 0.0 | 0.0 | 0.0 | 0.0 | 0.0 | 0.0 |
| 2002 | 0.0 | 0.0 | 0.0 | 0.0 | 0.0 | 0.0 | 0.0 | 0.0 | 0.0 | 0.0 | 0.0 |
| 2001 | 0.0 | 1.0 | 0.0 | 0.0 | 0.0 | 0.0 | 0.0 | 0.0 | 0.0 | 0.0 | 0.0 |
| 2000 | 0.0 | 1.0 | 0.0 | 0.0 | 0.0 | 0.0 | 0.0 | 1.0 | 0.0 | 0.0 | 0.0 |
| 1999 | 0.0 | 1.0 | 0.0 | 0.0 | 4.0 | 0.0 | 0.0 | 0.0 | 0.0 | 0.0 | 0.0 |
| 1998 | 0.0 | 0.0 | 0.0 | 0.0 | 1.0 | 0.0 | 0.0 | 0.0 | 0.0 | 0.0 | 0.0 |
| 1997 | 0.0 | 0.0 | 0.0 | 0.0 | 0.0 | 0.0 | 0.0 | 0.0 | 0.0 | 0.0 | 0.0 |
| 1996 | 0.0 | 0.0 | 0.0 | 0.0 | 1.0 | 0.0 | 0.0 | 0.0 | 0.0 | 0.0 | 0.0 |
| 1995 | 0.0 | 0.0 | 0.0 | 0.0 | 0.0 | 0.0 | 0.0 | 0.0 | 0.0 | 0.0 | 0.0 |
| 1994 | 0.0 | 0.0 | 0.0 | 0.0 | 0.0 | 0.0 | 0.0 | 0.0 | 0.0 | 0.0 | 0.0 |
| 1993 | 0.0 | 0.0 | 0.0 | 0.0 | 1.0 | 0.0 | 0.0 | 1.0 | 0.0 | 0.0 | 0.0 |
| 1992 | 0.0 | 0.0 | 0.0 | 0.0 | 0.0 | 0.0 | 0.0 | 0.0 | 0.0 | 1.0 | 0.0 |
| 1991 | 0.0 | 0.0 | 0.0 | 0.0 | 2.0 | 0.0 | 0.0 | 0.0 | 0.0 | 0.0 | 0.0 |
| 1990 | 0.0 | 1.0 | 0.0 | 0.0 | 1.0 | 0.0 | 0.0 | 1.0 | 1.0 | 0.0 | 0.0 |
| 1989 | 0.0 | 3.0 | 0.0 | 0.0 | 7.0 | 0.0 | 0.0 | 2.0 | 2.0 | 4.0 | 0.0 |
| 1988 | 0.0 | 3.0 | 0.0 | 0.0 | 9.0 | 0.0 | 0.0 | 3.0 | 2.0 | 1.0 | 0.0 |
| 1987 | 0.0 | 0.0 | 0.0 | 0.0 | 4.0 | 0.0 | 0.0 | 0.0 | 1.0 | 0.0 | 0.0 |
| 1986 | 0.0 | 0.0 | 0.0 | 0.0 | 1.0 | 0.0 | 0.0 | 1.0 | 0.0 | 0.0 | 0.0 |
| 1985 | 0.0 | 0.0 | 0.0 | 0.0 | 0.0 | 0.0 | 0.0 | 0.0 | 0.0 | 0.0 | 0.0 |
| 1984 | 0.0 | 0.0 | 0.0 | 0.0 | 0.0 | 0.0 | 0.0 | 0.0 | 0.0 | 0.0 | 0.0 |
| 1983 | 0.0 | 0.0 | 0.0 | 0.0 | 1.0 | 0.0 | 0.0 | 0.0 | 0.0 | 0.0 | 0.0 |
| 1982 | 0.0 | 0.0 | 0.0 | 0.0 | 0.0 | 0.0 | 0.0 | 0.0 | 0.0 | 0.0 | 0.0 |
Distribution map
Distribution - 2017
This map shows the observed distribution of the Yellow-faced Honeyeater for 2017.
The red circles are the grid cells where Yellow-faced Honeyeater have been reported.
The transparency of the red circles indicate how many surveys sheets were submitted for that grid cell; the darker the red the more reliable the data. Of the 315 grid cells with reports, 83 had only one sheet; an example is grid number A11.
The size of the circle represents the reporting rate. The maximum reporting rate for Yellow-faced Honeyeater was 100.0% (eg grid number A11) and the minimum was 1.2% (eg grid number K14). 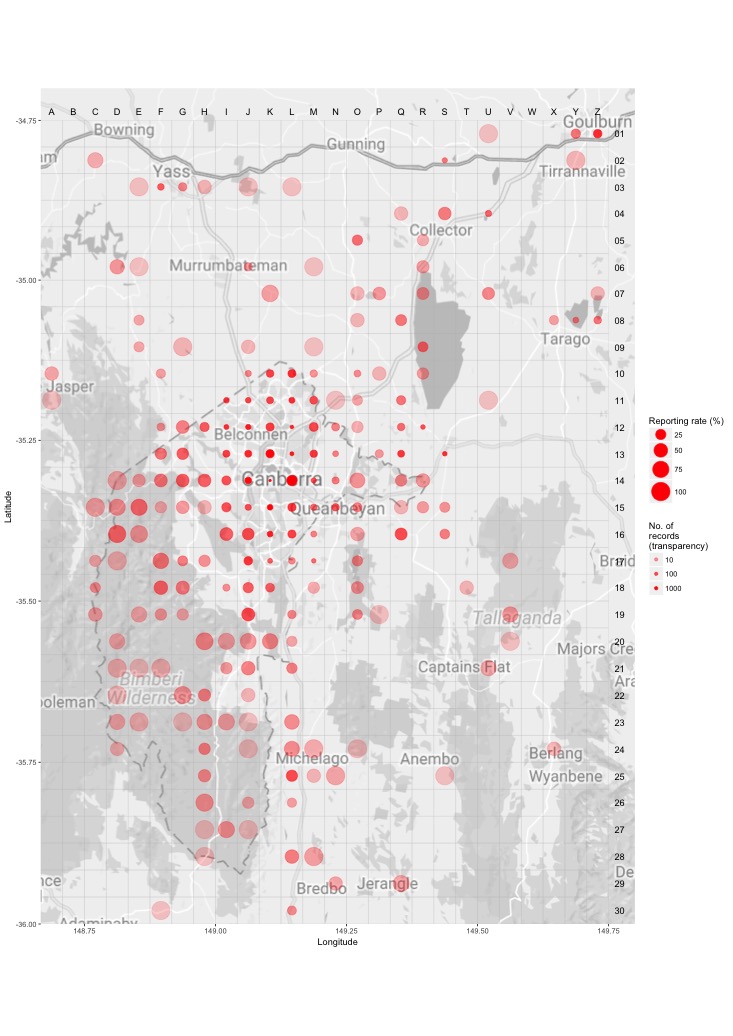
Distribution - all years
This map shows the observed distribution of the Yellow-faced Honeyeater for all years.
The red circles are the grid cells where Yellow-faced Honeyeater have been reported.
The transparency of the red circles indicate how many surveys sheets were submitted for that grid cell; the darker the red the more reliable the data. Of the 703 grid cells with reports, 55 had only one sheet; an example is grid number A12.
The size of the circle represents the reporting rate. The maximum reporting rate for Yellow-faced Honeyeater was 100.0% (eg grid number A12) and the minimum was 1.3% (eg grid number K3). 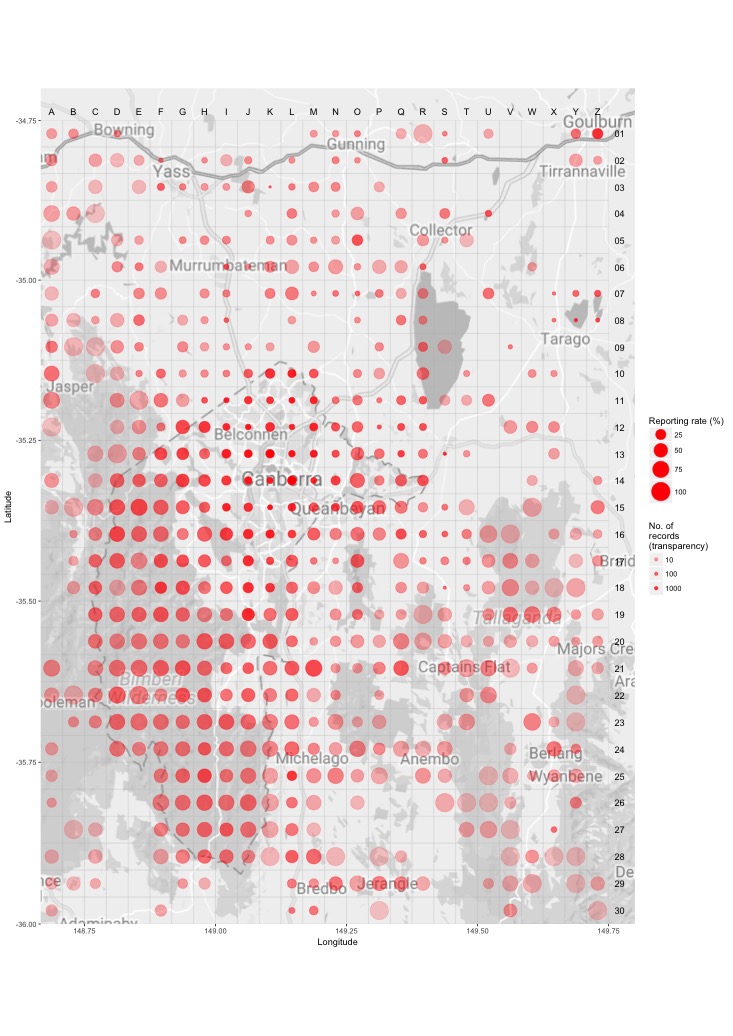
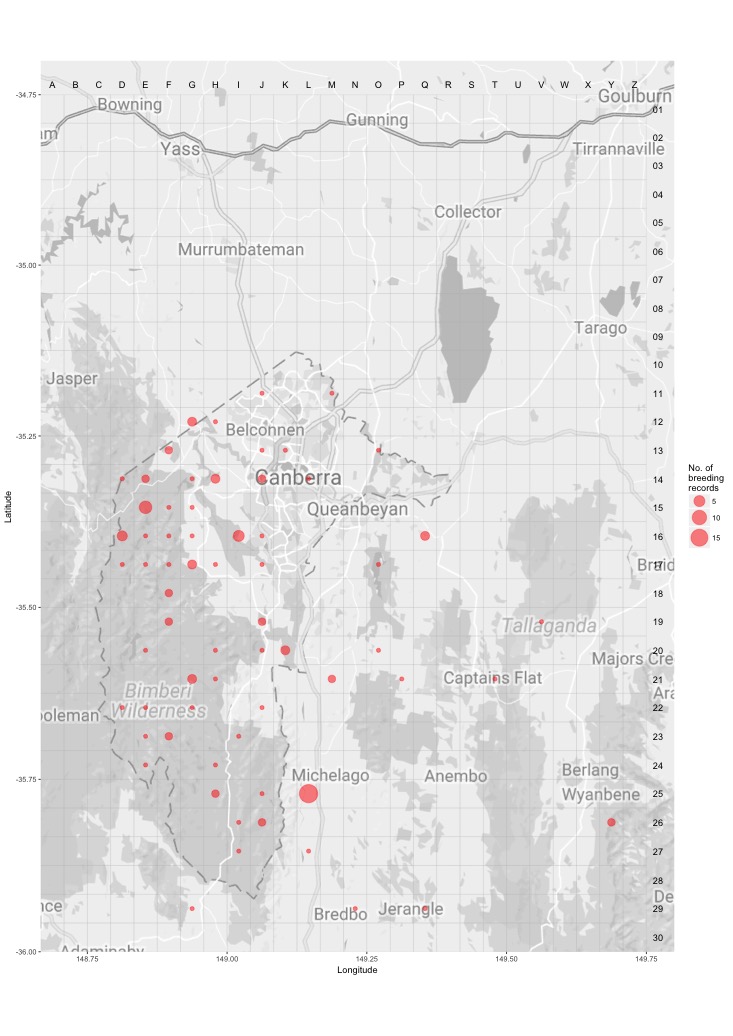
Breeding map
Breeding - 2017
This map shows the breeding distribution of the Yellow-faced Honeyeater for 2017.
The red circles are the grid cells where breeding activity for Yellow-faced Honeyeater have been reported.
The size of the circle represents the number of reports. 
Breeding - all years
This map shows the breeding distribution of the Yellow-faced Honeyeater for all years.
The red circles are the grid cells where breeding activity for Yellow-faced Honeyeater have been reported.
The size of the circle represents the number of reports.